10.9%
2023 Return
11.0%
Trailing 1-Year Return
6.0%(2)
Annualized Distribution Rate
10.9%
2023 Return
11.0%
Trailing 1-Year Return
6.0%(2)
Annualized Distribution Rate
Monthly and Annual Returns
| Jan | Feb | Mar | Apr | May | Jun | Jul | Aug | Sep | Oct | Nov | Dec | YTD | |
|---|---|---|---|---|---|---|---|---|---|---|---|---|---|
| 2024 | 1.19% | 0.50% | 0.50% | – | – | – | – | – | – | – | – | – | 2.2% |
| 2023 | 1.19% | 0.44% | 0.44% | 0.44% | 0.44% | 0.44% | 0.44% | 0.44% | 0.44% | 0.44% | 0.44% | 5.43% | 10.9% |
| 2022 | 1.19% | 0.44% | 0.44% | 0.44% | 0.44% | 0.44% | 0.44% | 0.44% | 0.44% | 0.44% | 0.44% | 0.44% | 6.0% |
| 2O21 | – | 0.44% | 0.44% | 0.44% | 0.44% | 0.44% | 0.44% | 0.44% | 0.44% | 0.44% | 0.44% | 0.44% | 4.8% |
Gray Harbor Government Income REIT
S&P 500 Index
Annualized Return
7.0%
13.2%
Standard Deviation
2.8%
17.0%
Sharpe Ratio
1.6
0.6
Worst % Drawdown (Month)
0.0%
-9.2%
Worst % Drawdown (Total)
0.0%
-24.5%
% of Positive Months
100%
66%
% of Negative Months
0%
34%
Correlation to S&P 500
0.11
N/A
(1) Returns reflect Gray Harbor Government Income REIT’s returns after the payment of all fees, expenses and promotional interest if earned by the Advisor. The return information was calculated based on distributions and increase in the net asset value (“NAV”) per share of the common stock of Gray Harbor Government Income REIT, which NAV was determined to be $1,049 as of January 1, 2024, and $1,000 as of January 1, 2021. The most significant component of NAV consists of estimated fair values of real property assets. As with any real property valuation protocol, the estimated fair values of real properties are based on a number of judgments, assumptions or opinions about future events that may or may not prove to be correct. As return information is calculated based on NAV, return information presented will be impacted should the assumptions on which NAV was determined prove to be incorrect. Further, Gray Harbor Government Income REIT shareholders may not realize Gray Harbor Government Income REIT’s most recently computed NAV per share of common stock in the event the shareholder attempts to sell shares or upon the liquidation of Gray Harbor Government Income REIT. See the Memorandum for information about the valuation procedures followed by Gray Harbor Government Income REIT in connection with its determination of NAV. Individual results may vary due to, but not limited to, timing of investment, reinvestments of dividends, redemptions, special dividend payments, shareholder dilution, and other factors. The year 2021 represents a partial year of performance. Past performance is not indicative of future results.
(2) Reflects the most recent month’s distribution annualized and divided by the prior month’s net asset value, which is inclusive of all fees and expenses. Distributions are not guaranteed and may be funded from the sources other than cash flow from operations. Monthly distributions shown are calculated at a fund level and are shown on a monthly basis. Actual investor distributions are accrued on a daily basis and paid monthly. Individual investor distributions will vary.
Gray Harbor Government Income REIT
| Annualized Return | 7.0% |
|---|---|
| Standard Deviation | 2.8% |
| Sharpe Ratio | 1.6 |
| Worst % Drawdown (Month) | 0.0% |
| Worst % Drawdown (Total) | 0.0% |
| % of Positive Months | 100% |
| % of Negative Months | 0% |
| Correlation to S&P 500 | 0.11 |
S&P 500 Index
| Annualized Return | 13.2% |
|---|---|
| Standard Deviation | 17.0% |
| Sharpe Ratio | 0.6 |
| Worst % Drawdown (Month) | -9.2% |
| Worst % Drawdown (Total) | -24.5% |
| % of Positive Months | 66% |
| % of Negative Months | 34% |
| Correlation to S&P 500 | N/A |
(1) Returns reflect Gray Harbor Government Income REIT’s returns after the payment of all fees, expenses and promotional interest if earned by the Advisor. The return information was calculated based on distributions and increase in the net asset value (“NAV”) per share of the common stock of Gray Harbor Government Income REIT, which NAV was determined to be $1,049 as of January 1, 2024, and $1,000 as of January 1, 2021. The most significant component of NAV consists of estimated fair values of real property assets. As with any real property valuation protocol, the estimated fair values of real properties are based on a number of judgments, assumptions or opinions about future events that may or may not prove to be correct. As return information is calculated based on NAV, return information presented will be impacted should the assumptions on which NAV was determined prove to be incorrect. Further, Gray Harbor Government Income REIT shareholders may not realize Gray Harbor Government Income REIT’s most recently computed NAV per share of common stock in the event the shareholder attempts to sell shares or upon the liquidation of Gray Harbor Government Income REIT. See the Memorandum for information about the valuation procedures followed by Gray Harbor Government Income REIT in connection with its determination of NAV. Individual results may vary due to, but not limited to, timing of investment, reinvestments of dividends, redemptions, special dividend payments, shareholder dilution, and other factors. The year 2021 represents a partial year of performance. Past performance is not indicative of future results.
(2) Reflects the most recent month’s distribution annualized and divided by the prior month’s net asset value, which is inclusive of all fees and expenses. Distributions are not guaranteed and may be funded from the sources other than cash flow from operations. Monthly distributions shown are calculated at a fund level and are shown on a monthly basis. Actual investor distributions are accrued on a daily basis and paid monthly. Individual investor distributions will vary.
Tax-Equivalent Yields
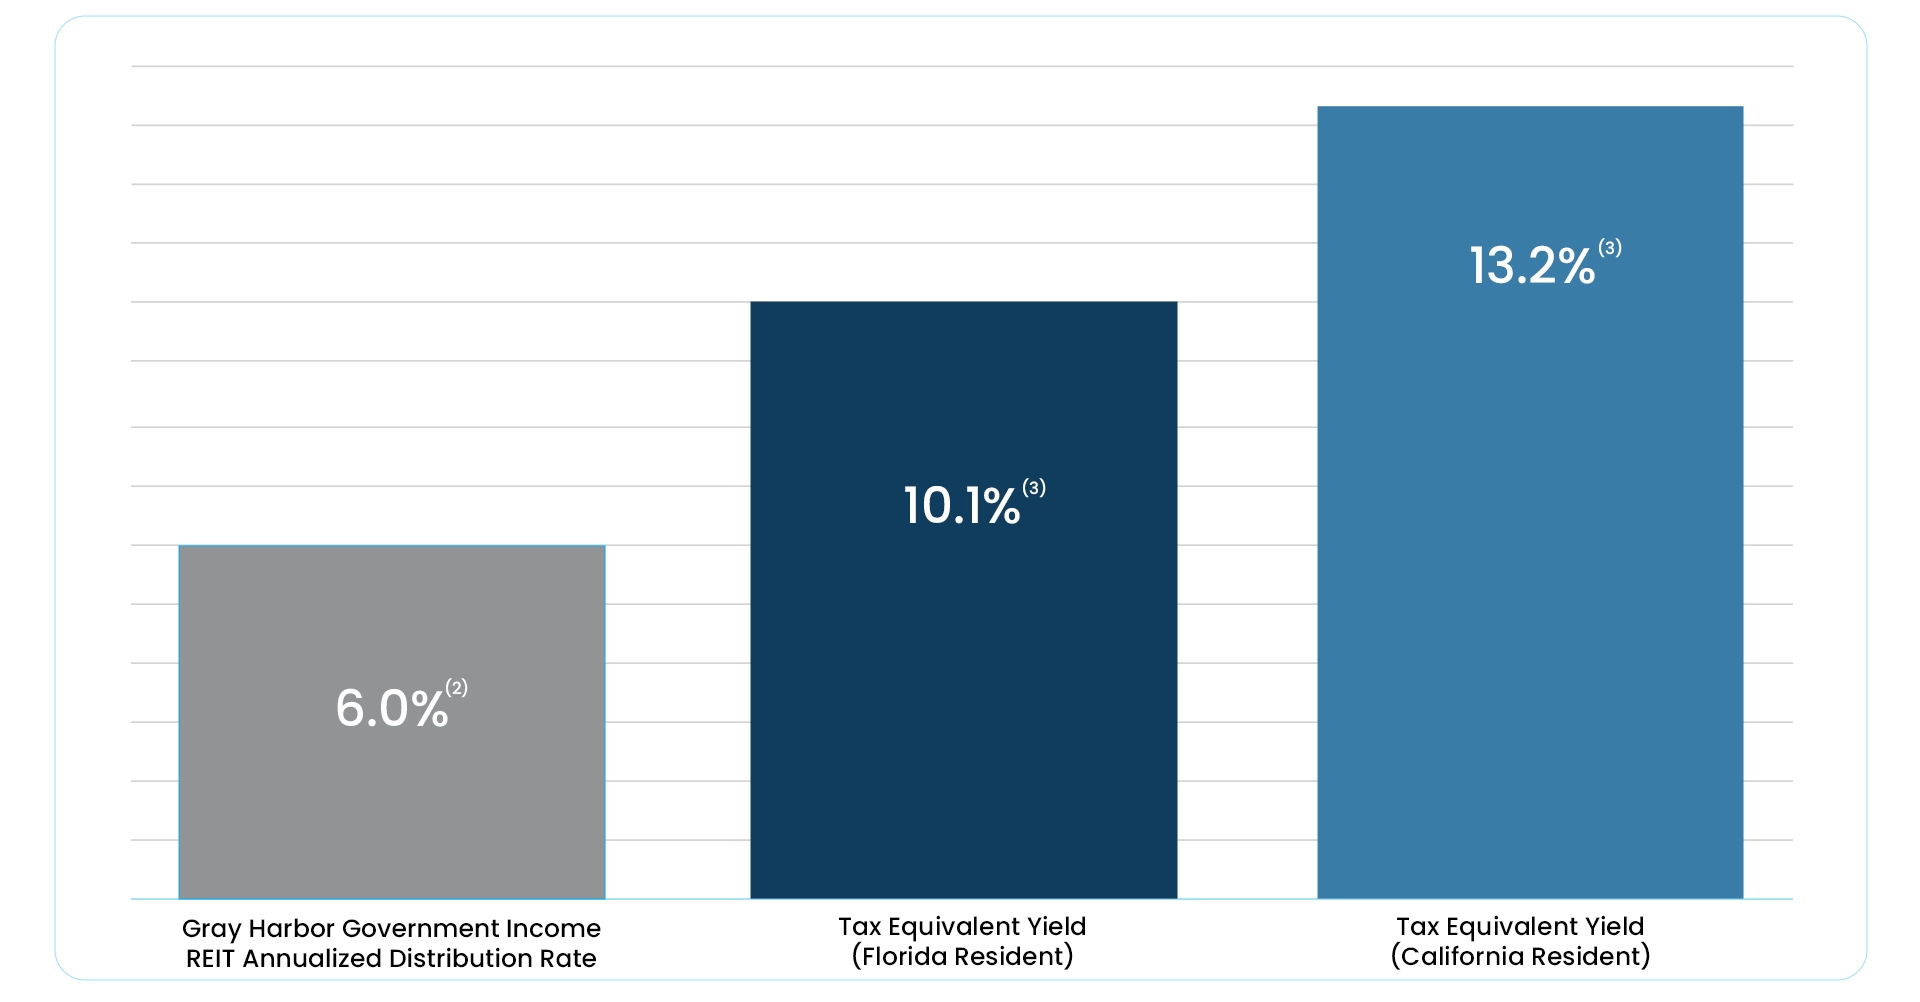
(3) 100% of the Gray Harbor Government Income REIT’s dividend distributions since inception have been paid as return of capital. Each individual’s tax situation varies. Please seek guidance from a tax advisor. The information presented here should not be construed as investment, legal or tax advice. Return of capital distributions reduce an investor’s basis in the year received, and generally defer tax liabilities until the underlying position is sold. Items such as depreciation and amortization, which are non-cash items, can reduce taxable income for investors in the Gray Harbor Government Income REIT. The Tax Equivalent Yield shown assumes a Florida investor who is currently invested in Gray Harbor Government Income REIT with a maximum federal income tax rate of 37%, net investment income tax of 3.8%, and 0% state income tax rate and a California investor who is currently invested in Gray Harbor Government Income REIT with a maximum federal income tax rate of 37%, net investment income tax of 3.8%, and 14.4% state income tax rate. While the Gray Harbor Government Income REIT’s current distributions are all classified as return of capital, there is no assurance or guarantee that this classification will continue in future time periods.
Historical NAV Per Share
| Jan | Feb | Mar | Apr | May | Jun | Jul | Aug | Sep | Oct | Nov | Dec | |
|---|---|---|---|---|---|---|---|---|---|---|---|---|
| 2024 | $1,049 | $1,049 | $1,049 | – | – | – | – | – | – | – | – | – |
| 2023 | $1,000 | $1,000 | $1,000 | $1,000 | $1,000 | $1,000 | $1,000 | $1,000 | $1,000 | $1,000 | $1,000 | $1,000 |
| 2022 | $1,000 | $1,000 | $1,000 | $1,000 | $1,000 | $1,000 | $1,000 | $1,000 | $1,000 | $1,000 | $1,000 | $1,000 |
| 2O21 | $1,000 | $1,000 | $1,000 | $1,000 | $1,000 | $1,000 | $1,000 | $1,000 | $1,000 | $1,000 | $1,000 | $1,000 |